Insights from rock solid factuality
Your thesis is only as trustworthy as your data quality. Therefore we show you how each number is linked to the SEC filing and how each metric is calculated. You will trust your analysis more when it's fully transparent and free of black boxes. Core features are demoed below using AAPL as an example.
Every number is traced to the SEC filing.
Whenever you find a number that is critical or suspicious, click it to see its source in the SEC filing. No need to second-guess anymore. Live demo below.
Locating SEC filing...
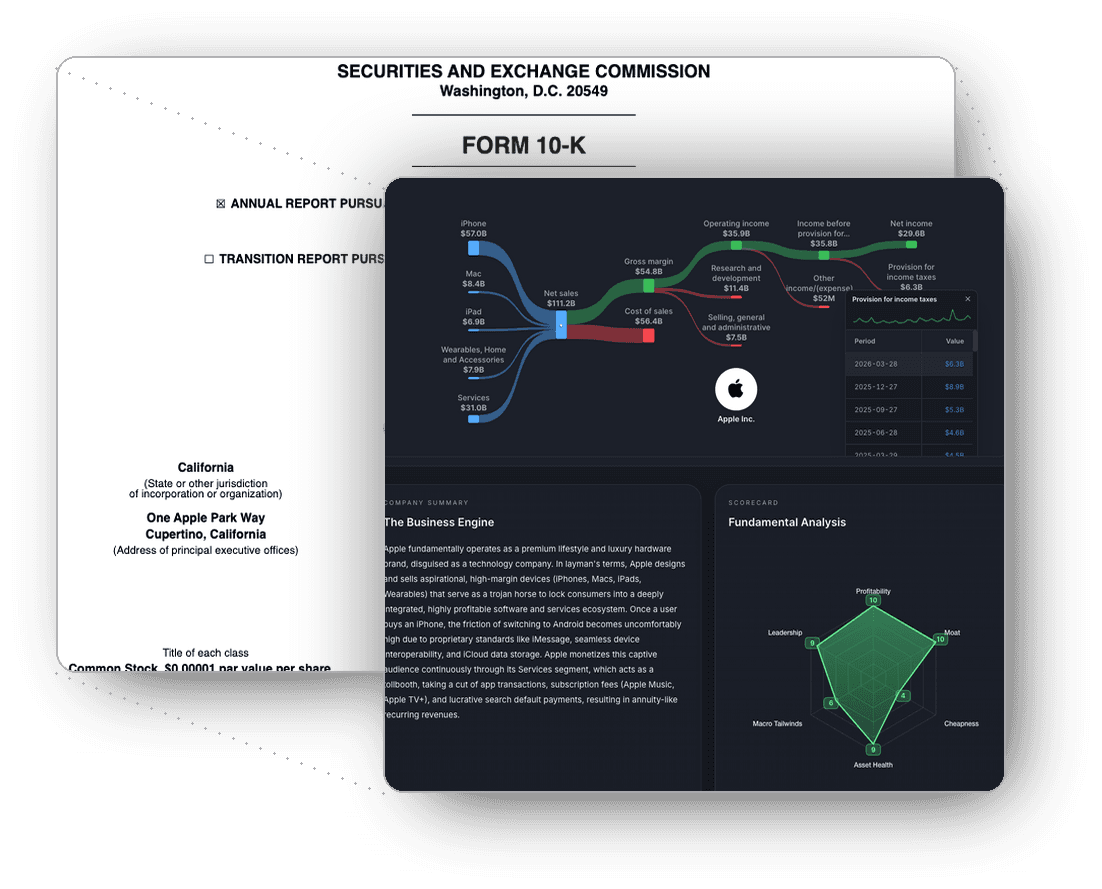
Click a node, then a value in its history, to trace it back to the exact SEC filing.
Every metric is transparent.
Ever wondered how a metric is defined or whether an outrageous one is wrong? You can always check out the exact calculation process. Again, every number is linked to the original SEC filing. Better yet, you can define your own metrics using the numbers from historical financial statements for each company. Try the live demo below.
“Use a picture. It’s worth a thousand words.”
You will always understand situations better with an image. Below is how the money flows through Apple’s business engine. See the case for TSLA to understand their huge difference in profitability.
Locating SEC filing...
Simulate the future cashflow.
Our DCF model has two FCF growth periods and two discounting periods. You can solve any variable by providing the rest. For example: What is the implied growth rate given a P/E ratio? How many years the company must survive to make the current valuation fair? Warren Buffett doesn’t calculate exact DCF number — being too close to need calculation implies insufficient safety margins — but it doesn’t hurt to simulate the future cheaply.
Frequently Asked Questions
Why don't I just use free tools like Yahoo/Google Finance?
Believe it or not, much of their data is wrong. Fundamental financial data inevitably becomes lossy when they are forced into standardized templates. (Detail here). For fundamental analysis, the heterogeneous filing structures across companies reflects the true differences across their business operations. They are meaningful signals and shouldn't be compressed. Therefore, we present the original data from each company's original filing to SEC. They can't be used to build models across companies but reflect each company's most truthful nature. In a way, DeepFundamental is a financial statements aggregator for every company traded in the US equity market.
Do you offer anything other paid services don’t?
Actually, we offer less than most stock analysis tools if you mean features. For example, we don't have screener, watchlist, insider trading watcher, rating from analysts, price targets, etc. That's by design. We hope to do one thing only: to help value investors understand a company from its fundamental data. We deliberately stripped out inessential features to focus on the information that matters in understanding a business: Quickly understanding a company by visualizing its financial statements, user- defined metrics, reliable and traceable numbers, the DCF simulator, etc. DeepFundamental was built because no such tool exists. It was built first for our own investment investigation. Now, we want to share it with other self-directed, financially literate investors.
Who are this product built for?
Is this product an one stop solution for fundamental analysis?
Secure your lifetime founding rate.
Full Features
- ✦Full access across on all stocks trading in the U.S.
- ✦10-year historical financial data